

Plant Hardiness Zones
Learning what plants you can grow successfully depends on the area or region where you live
Plant Hardiness Zones
 A plant hardiness zone is a geographically-defined zone in which a specific category of plant life is capable of growing, as defined by temperature hardiness, or ability to withstand the minimum temperatures of the zone. The zones were first developed by the United States Department of Agriculture (USDA), and have subsequently been adopted elsewhere. They are categorized according to the mean of the lowest temperature recorded each winter, termed the "average annual minimum temperature". Thus if five successive winters reach respective minima of -14 °C, -12 °C, -8 °C, -16 °C, and -13 °C, the mean coldest temperature is -12.6 °C, placing the site in zone 7.
Benefits and Criticisms of Plant Hardiness Zones
The hardiness zones are effective in that, for many situations, extremes of winter cold are a major determining factor in whether a plant species can be cultivated outdoors at a particular location. However, it does have a number of drawbacks, most significantly in not incorporating summer heat levels into the zone determination. Thus sites which may have the same mean winter minima, but markedly different summer temperatures, will still be accorded the same hardiness zone. An extreme example is the Shetland Islands and southern Alabama, which are both on the boundary of zones 8 and 9 and share the same winter minima, but very little else in their climates; in summer, the humid subtropical climate of Alabama is about 20 degrees Celsius hotter than the oceanic climate of Shetland, and there are very few plants that can be grown at both locations. Due to its maritime climate, the UK is in AHS Heat Zone 2 (having 1 to 8 days hotter than 30 degrees Celsius), whereas Alabama is in Zones 7 to 9 (61 to 150 days hotter than 30 degrees Celsius).Another problem is that the hardiness zones do not take into account the reliability of the snow cover. Snow acts as an insulator against extreme cold temperatures, protecting the root system of hibernating plants. If the snow cover is reliable (then present during the coldest days), the actual temperature to which the roots are exposed is not as low as the hardiness zone number would indicate. As an example, Quebec City in Canada is located in zone 4 but can rely on an important snow cover every year, making it possible to cultivate plants normally rated for zones 5 or 6, whereas in Montreal, located in zone 5, it is sometimes difficult to cultivate plants adapted to the zone because of the unreliable snow cover.
Other factors that affect plant survival but are not considered in hardiness zones are soil moisture, humidity, the number of days of frost, and the risk of a rare catastrophic cold snap. Some risk evaluation, the probability of getting a particularly severe low temperature, often would be more useful than just the average conditions.
Lastly, many plants will survive in a locality but won't flower if the daylength is inappropriate or if they require vernalisation (a particular duration of low temperature). The low temperature statistic is only appropriate for woody perennial species, and even then its use is limited. With annuals the time of planting can often be adjusted to allow growth beyond their normal geographical range.
An alternative system for describing plant hardiness is to use indicator plants (the USDA also publishes a list of these to go with their map). Common plants with known limits to their range are used. For example, many people will know whether lemons will grow in their locality. If you then say Geraldton Wax will grow more or less where lemons will grow you have defined the range of Geraldton Wax with some accuracy (whether or not it will flower is another problem). Unfortunately no two plant species have exactly the same requirements and there are even within-species differences. 'Meyer' lemons, for example, are more cold tolerant than 'Eureka'. You can really only define core areas and they are often fairly arbitrary.[top]
Britain and Ireland Plant Hardiness Zones
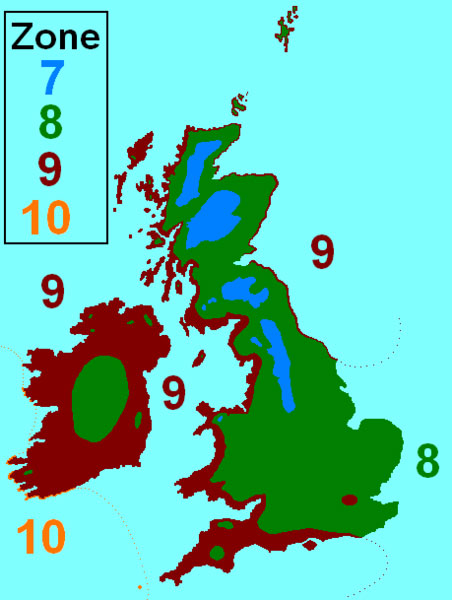
Britain and Ireland's hardiness zones
Due to the moderating effect of the Gulf Stream on the Irish and British temperate maritime climate, Britain, and Ireland even more so, have rather milder winters than their northerly position suggests.
This means that the hardiness zones relevant to Britain and Ireland are quite high, from 7 to 10, as shown below.
* 7. In Scotland the Grampians, Highlands and locally in the Southern Uplands and in England the Pennines. * 8. Most of England, Wales and Scotland, and parts of central Ireland. * 9. Most of western and southern England and Wales, western Scotland, also a very narrow coastal fringe on the east coast of Scotland and northeast England (within 5 km of the North Sea), London, and most of Ireland. * 10. Very low lying coastal areas of the southwest of Ireland, and the Isles of Scilly.[top]
North American Plant Hardiness Zones
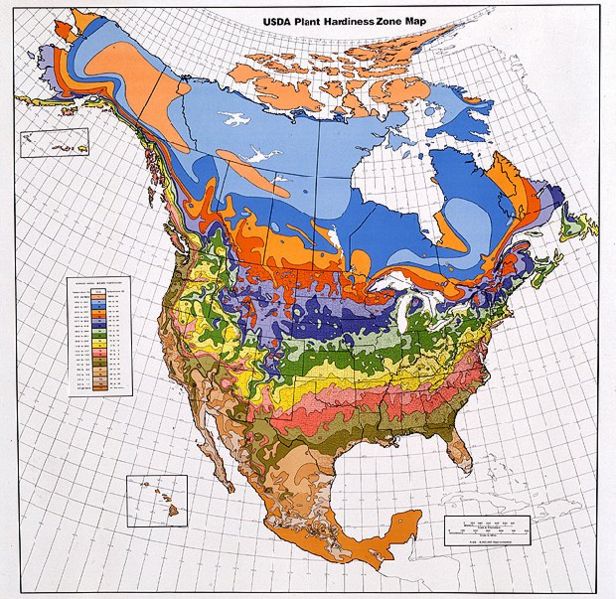
USDA Map of North American hardiness zones, issued 1990
Using as its basis the average annual minimum temperature for a given location, the idea of the USDA map is that it provides an easy guideline for categorizing locations suitable for winter survival of a rated plant in an "average" winter. Since temperatures in the non-coastal-adjacent areas of the continent rarely present a consistent experience from year to year, and occasionally present a major--and often agriculturally devastating--deviation from the average minimum, it is difficult to use this map for much of the country with any long-term reliability, at least in areas close to the margin of a plant's rated hardiness-zone.
The USDA first issued its standardized hardiness-zone map in 1960, and revised it in 1965. A new map was issued in 1990, based on U.S. and Canadian data from 1974 through 1986 (and 1971-1984 for Mexico). While the 1990-issue map utilized approximately double the number of stations, it also divided the temperature-zones into five-degree a/b zones for greater accuracy. This revised map showed many areas to be suddenly colder than the 1960 map, due largely to a number of severely colder winters in the central and eastern U.S. in the 1974-1986 data-gathering period as opposed to the mid-20th-century data-sampling period used in the 1960 map.
The 1990 map shows 10 different zones, each of which represents an area of winter hardiness for the plants of agriculture and our natural landscape. This was revised to introduce zone 11, representing areas that have average annual minimum temperatures above 40°F (4.4°C) and that are therefore essentially frost-free.
In 2003, a preliminary draft of a new USDA map was produced by the American Horticultural Society (AHS), compiled by Meteorological Evaluation Services Co., Inc. of Amityville, NY, using temperature data collected from July 1986 to March 2002. This was a period of warmer winters than the 1974-1986 period, especially in the eastern U.S.A., and thus the 2003 map placed many areas approximately a half-zone higher (warmer) than the 1990 map had. Many have noted that the map seemed to have drifted closer to the original 1960 map in its overall zone-delineations. While the 2003 AHS draft map purported to show finer detail, for example reflecting urban heat islands by showing the downtown areas of several cities (e.g., Baltimore, Maryland and Washington, DC) as a full zone warmer than outlying areas, the map also did away with the detailed a/b half-zones introduced in the 1990 map, an omission widely criticized by horticulturists and gardeners due to the coarseness of the resulting map. The USDA rejected the AHS 2003 draft map; the agency has stated it is creating its own internal map in an interactive computer format. As of May 2007 the AHS and the National Arboretum websites still present the 1990 map as current.
In addition, the National Arbor Day Foundation in the United States recently completed an extensive updating of U.S. Hardiness Zones in 2006, utilizing essentially the same data used by the AHS, the then-most-recent 15 years data available from more than 5,000 National Climatic Data Center cooperative stations across the United States. Once the Foundation analyzed the new data, hardiness zones were revised, generally reflecting warmer recent temperatures in many parts of the country. The Arbor Day Foundation used the updated versions of the same sources of data as had been utilized by the U.S. Department of Agriculture in the creation of its hardiness zone maps. The 2006 map appears to validate the data used in the 2003 draft completed by the AHS. Like the AHS map, it also did away with the more detailed a/b half-zone delineations.[top]
Canadian Plant Hardiness Zones
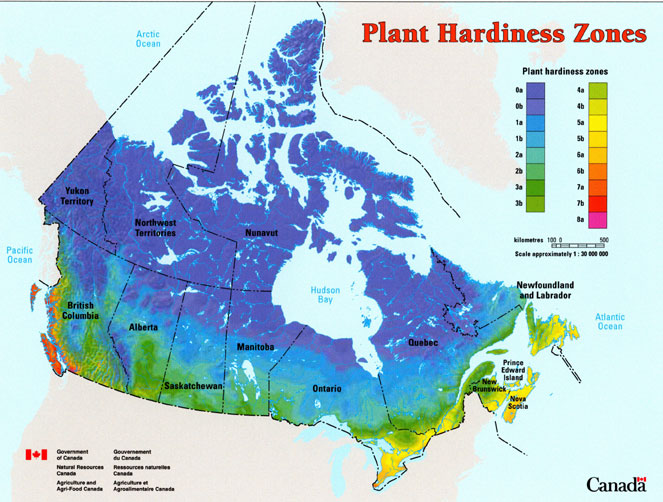
From Natural Resources Canada
U.S. Cities
Here are the USDA plant hardiness zones for major U.S. cities (based on the draft 2003 map):| City | Zone | City | Zone |
| Albuquerque, New Mexico | 7 | Oklahoma City, Oklahoma | 7 |
| Anchorage, Alaska | 4 | Omaha, Nebraska | 5 |
| Atlanta, Georgia | 7-8 | Orlando, Florida | 10 |
| Baltimore, Maryland | 7-8 | Philadelphia, Pennsylvania | 7 |
| Boston, Massachusetts | 6-7 | Phoenix, Arizona | 9 |
| Burlington, Vermont | 4 | Pittsburgh, Pennsylvania | 6 |
| Chicago, Illinois | 5-6 | Portland, Maine | 5-6 |
| Cincinnati, Ohio | 7 | Portland, Oregon | 9 |
| Dallas, Texas | 8 | Raleigh, North Carolina | 8 |
| Denver, Colorado | 5-6 | St. Louis, Missouri | 7 |
| Detroit, Michigan | 5-6 | Salt Lake City, Utah | 7 |
| Honolulu, Hawaii | 11 | San Antonio, Texas | 9 |
| Houston, Texas | 9 | San Diego, California | 10 |
| Las Vegas, Nevada | 9 | San Francisco, California | 10 |
| Los Angeles, California | 10 | Seattle, Washington | 8 |
| Memphis, Tennessee | 8 | Tampa, Florida | 9-10 |
| Miami, Florida | 11 | Tucson, Arizona | 8 |
| Minneapolis, Minnesota | 5 | Tulsa, Oklahoma | 7 |
| Nashville, Tennessee | 7 | Washington, D.C. | 7-8 |
| New Orleans, Louisiana | 9 | Wichita, Kansas | 6 |
| New York, New York | 7 | Wilmington, Delaware | 7-8 |
[top]
Australian Hardiness Zones
The Australian continent, though surrounded by ocean, is drier than Europe or North America. Australia numbers its climate zones differently but these can be made roughly equivalent to North American hardiness zones by adding a factor of 6. For example, Australian Zone 3 is roughly equivalent to North America Zone 9. The higher Australian zone numbers have no US equivalents.* Zone 1 covers the alpine areas of south eastern Australia. * Zone 2 the tablelands of south east Queensland, New South Wales and Victoria, and the uplands of central Tasmania. * Zone 3 includes much of the southern half of the continent, except for near the coast. * Zone 4, because of the warmer seaboard, covers a broad area from coastal Queensland across to Shark Bay and Geraldton in the west, and includes the Mornington Peninsula, areas adjacent to Spencer Gulf and Adelaide, the south western coastal zone, Sydney and the north coast of NSW, along with a number of localities dotted all around the southern coast of the continent. * Zone 5 covers some of the Queensland coast, Western Australia north of Shark Bay, and across the top end. * Zone 6 includes the Queensland coast north of Cairns, Cape York Peninsula and the coast of the Northern Territory. * Zone 7 is mainly restricted to islands off the north coast.
There are problems with classifications of this type: the spread of weather stations is insufficient to give clear zones and too many places with different climates are lumped together. Only 738 Australian stations have records of more than ten years (one station per 98,491 hectares), though more populated areas have relatively fewer hectares per station. Local factors such as aspect, altitude, proximity to the sea also complicate the matter. For example, Mt. Isa has three climatic stations with more than a ten year record. One is in Zone 4a, one in Zone 4b and the other is in Zone 5a. Likewise, Sydney residents can choose between Zones 3a and 4b. Most other cities have similar problems. Different locations in the same city are suitable for different plants, making it hard to draw a meaningful map. There may even be a case for publishing a list of weather stations and their zone classification to allow best use of local conditions.[top]